Isolating EB-1A data into single years can lead to incorrect conclusions, such as EB-1A
approval rate
trends fluctuating rather than increasing or decreasing steadily due to changing policies,
events around
the world, and how applicants act. A spike in either denials or approvals over one year should not be
assumed to be a permanent change. Actual risk and potential for applicants to obtain an EB-1A visa
should be assessed using EB-1A visa trends 2018–2025, rather than by year. By conducting a
longitudinal
analysis of historical trends in EB-1A filings, applicant scrutiny levels, and actual responses to EB-1A
applications, one can observe a pattern not evident in shorter-term data.
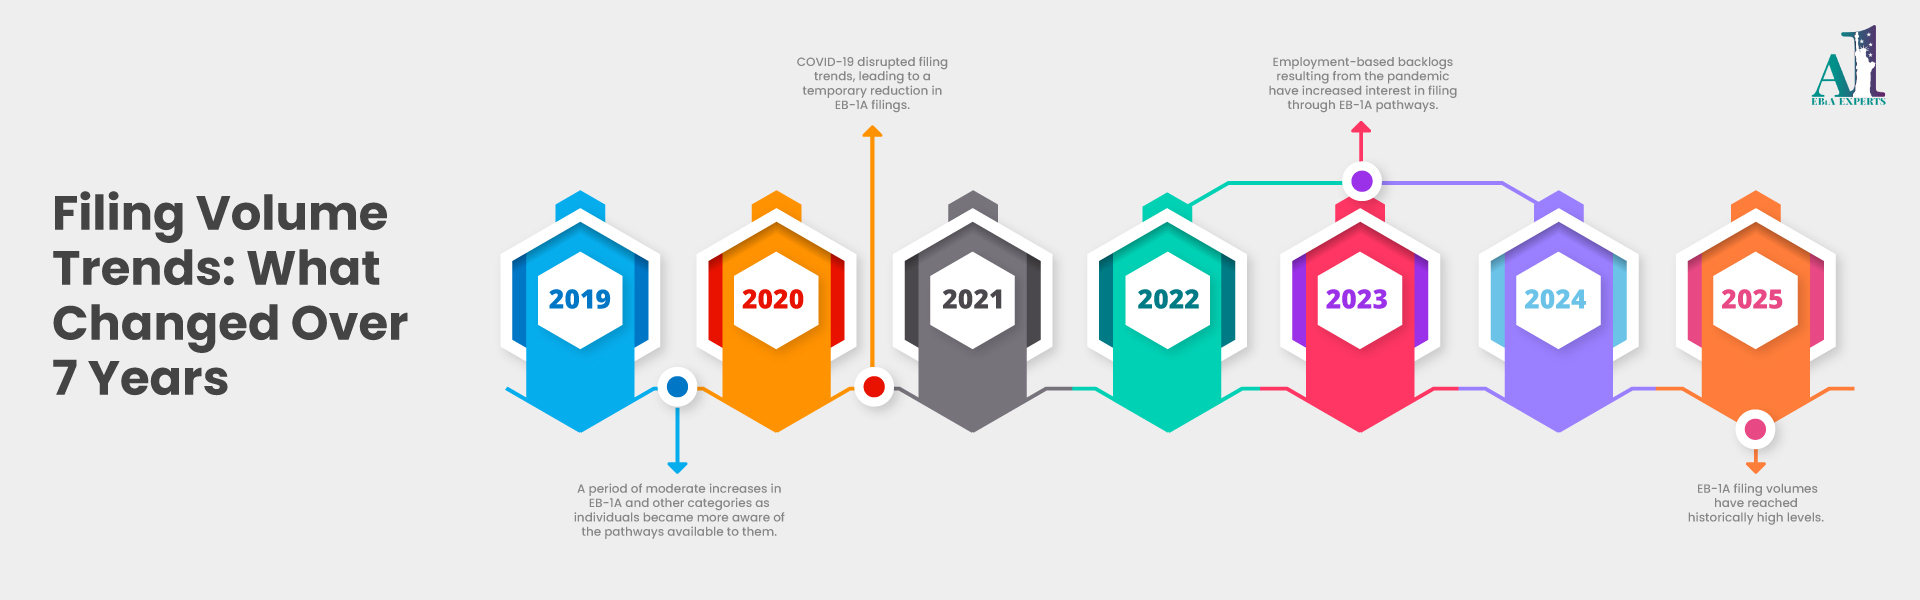
2. Filing Volume Trends: What Changed Over 7 Years
EB-1A filings by year have shown consistent increases since 2018, followed by accelerated growth
after
2020 as professionals began seeking alternatives to the backlogged categories previously in place. USCIS
data shows that the area of "extraordinary
ability" pathways has experienced a clear shift due to this
surge of interest.
Key points of inflection for filing patterns are as follows:
2019–2020: A period of moderate increases in EB-1A and other categories as individuals became
more aware of the pathways available to them.
2020–2021: COVID-19 disrupted filing trends, leading to a temporary reduction in EB-1A
filings.
2022–2024: Employment-based backlogs resulting from the pandemic have increased interest in
filing through EB-1A pathways.
2025: EB-1A filing volumes have reached historically high levels.
The overall EB-1A
immigration data does not suggest that the quality of applicants is lower; it reflects
changing strategies among professionals- many are preparing earlier in their careers, and more
senior-level professionals are now filing applications sooner. Additionally, the rise in filing volume
has not led to a corresponding drop in approval rates, thereby contradicting the notion that greater
popularity automatically lowers approval rates. In USCIS EB-1A data analysis, volume increases
reflect
growing demand for filings, not declining standards.
3. Approval vs Denial Rates: Patterns Over Time
In the period from 2018 through 2025, EB-1A
approval and denial rates are fluctuating but show identifiable patterns of increase and
decrease. There were higher approval rates during some years when applications were below average and
lower during higher-volume application periods; however, there was never an overall collapse in EB-1A
approvals during these periods.
Based on extraordinary ability green card statistics, we learn another important fact: Even though
higher
application volumes do not mean there will be fewer approvals, how the evidence was presented, as well
as
the manner in which the case was set up, were more significant in determining a final result than the
volume of applications received.
Three significant areas where there has been increased scrutiny by USCIS officers
over time include:
Demonstrated national and or internationally recognized impact.
Recognition from outside the employer.
Consistency of evidence submitted in all materials.
As scrutiny intensified, the number of granted applications (or "denials") increased slightly because
more borderline cases entered the application pool; however, the number of well-prepared, submitted
cases remained constant, resulting in a steady number of approvals over time. This is why the EB-1A
success rate by year shows variation but has not collapsed.
By analyzing multi-year data regarding EB-1A denial reasons, applicants can separate the actual
threats
to their case from noise. The trend indicates that in recent years there has been significant refinement
(i.e., adjustments to the volume and quality of the evidence), rather than a restriction, in the
evidence presented.
4. RFE Trends & Processing Time Shifts
The increased EB-1A
RFEs trends during the past couple of years is a clear indicator of the growing
number of RFEs issued since 2021, with consistent approval rates, but the increase in RFEs reflects
greater scrutiny rather than an increased likelihood of denial.
The introduction of premium processing and the resulting reduced processing times will allow visa
applicants to have their applications processed quickly, but the EB-1A visa statistics indicate
that
faster processing does not translate into less scrutiny or due diligence. RFEs are issued through a
"reviewing time" instead of issuing RFEs once an application is submitted.
Presently, based on the most recent data regarding EB-1A RFEs, the RFEs will be significantly more
focused on impact explanation, story consistency, and narrative consistency instead of merely meeting
the threshold for EB-1A eligibility. Due to the quicker processing timeframe now available through
premium processing, the pressure is shifted to present clear and concise information with a consistent
narrative at the time the application is initially submitted, now more than ever.
5. What the Data Signals for 2026–2027 Applicants
Looking to the future, the EB-1A visa trends 2018–2025 indicate that, rather than seeing a large
spike
in
EB-1A approvals or a systemic tightening of EB-1A visa approvals, applicants will be able to
strategically
file for EB-1A visas.
Currently, the types of applicants who are best positioned to file for EB-1A visas
are those who have a:
History of sustained recognition for multiple years
Independent validation of their contributions
Well-defined narrative alignment with the USCIS EB-1A visa eligibility criteria
EB-1A USCIS data analysis will allow current applicants to use it as a roadmap and not a
deterrent to filing for EB1A visas, as it indicates that multi-year preparation time is highly
correlated to increased rates of success with USCIS, especially now that USCIS officials are valuing the
tightness of a narrative in relation to a larger number of submissions.
A review of seven years of EB-1A USCIS data analysis shows that being successful in this category
leads
to preparation, not urgency. Both EB-1A approval and denial rates have always favoured applicants
who
invest the time necessary to create a complete record, secure substantial third-party endorsements, and
develop a coherent narrative of ongoing extraordinary achievement. Understanding the trends in EB-1A
approvals today will allow you to prepare your materials consistent with the types of adjudication
expectations being utilized by USCIS.
6. FAQs
What are the EB-1A approval and denial trends from 2018 to 2025?
Approval rates fluctuated moderately while denials rose slightly during high-volume years. Overall,
long-term success rates remained stable when cases were well-prepared.
Has the EB-1A approval rate increased or decreased in recent years?
Recent years show stabilization rather than a sharp decline, despite higher filing volumes, according to
EB-1A visa statistics.
What are the most common reasons for EB-1A denials based on USCIS data?
Denials most often relate to insufficient demonstration of impact, lack of independent recognition, or
weak alignment across evidence.
How do EB-1A filing volumes correlate with approval rates?
Higher filings do not directly reduce approvals. Data shows preparation quality matters more than
applicant
volume.
Did COVID-19 or policy changes impact EB-1A adjudications?
Yes. COVID-19 caused temporary slowdowns, followed by increased filings and RFEs as processing
normalized.
How reliable is USCIS EB-1A data for predicting case outcomes?
While not predictive at the individual level, EB-1A USCIS data analysis is reliable for
identifying
macro
trends and risk signals.
What do recent EB-1A trends mean for applicants filing in 2025?
They suggest steady standards, higher scrutiny, and strong outcomes for applicants who prepare
strategically.
Rather than rushing to file, consider requesting a preliminary evaluation of your profile against
current EB-1A visa trends 2018–2025.


 December 29, 2025
 3 min read