The EB1A visa remains one of the most
distinguished but also one of the most difficult categories for a U.S. green card. According to USCIS
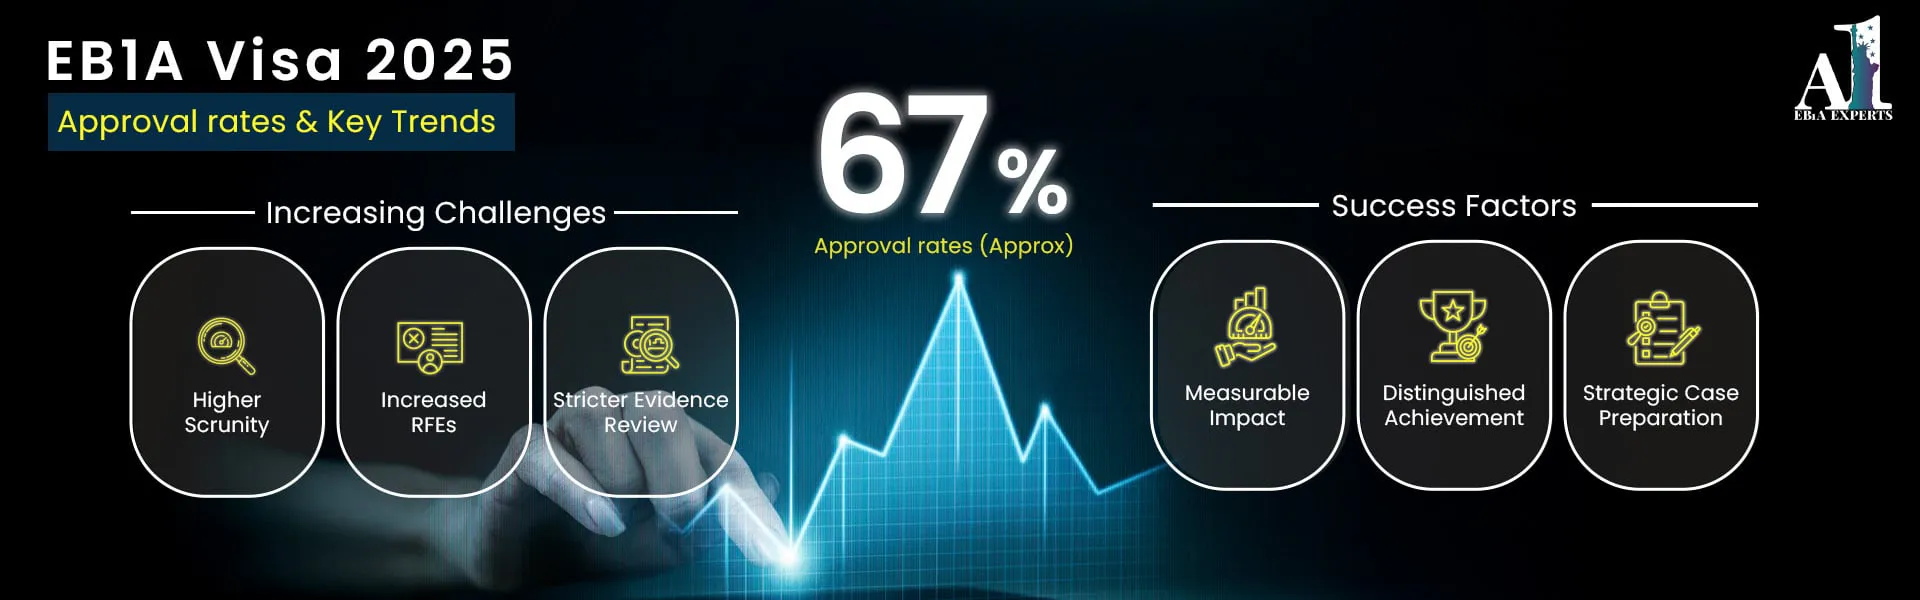
data, the EB1A approval rate for fiscal year 2025 was 66.9%. The trend
since then has been sharply downward. The quarterly rate fell from 74.7% in late 2024 to 32.2% in
April–June 2026, the latest published quarter. A new USCIS evidence policy issued in August 2026 and
continued Visa Bulletin backlogs for India and China add further pressure. These changes shape how
applicants prepare and who succeeds.
Understanding these trends is invaluable for those preparing to file in late 2026 or 2027, and can
profoundly affect the outcome of future applications.
The EB1A is a green card category for individuals with
extraordinary ability who have been recognized for sustained national or international acclaim.
Who qualifies and how is EB1A different?
Applicants must show a one-time major international award or meet at least three of ten regulatory
criteria. USCIS then weighs all the evidence together in a “final merits determination” to decide
whether the person is at the top of their field. EB1A provides permanent residency and can be
self-petitioned. The O1A is a non-immigrant visa. EB-2 NIW also needs no employer sponsor, but it uses a
different standard, the national-interest test, rather than extraordinary ability. I-140 approval is
only the first step, because the green card itself still depends on visa availability under the monthly
Visa Bulletin.
3. Why Approval Rates change Year to Year?
Changes in adjudication policies at USCIS, including the August 5, 2026 policy on evidence, RFEs,
and NOIDs (PA-2026-05)
Changes in filing volume. EB-1 receipts rose from about 41,000 in FY2024 to about 51,000 in FY2025.
Changes in officer training and internal guidance
By the strength and quality of the evidence presented
Changes in global high-skilled migration patterns and processing holds. USCIS paused decisions on
pending cases for nationals of 39 countries in December 2025–January 2026, and a federal court ruled
the pause unlawful on June 8, 2026, with an appeal expected.
USCIS publishes the counts of EB-1A petitions received, approved, denied, and pending each quarter, but
not a rate. The rates here are approvals divided by approvals plus denials. Sites that divide by pending
cases or receipts show different numbers, which is why figures vary online. The latest data shows a
clear shift across employment categories, and EB1A has moved the most. Thoroughly developed EB1A applications with well-documented evidence
can still succeed. Quality preparation remains the key to the outcome.
5. Understanding the 2025 Approval Landscape
Overall Approval Rate
In FY2025, USCIS approved 12,468 and denied 6,165 EB-1A petitions, a 66.9% rate. Across the first
three quarters of FY2026 (October 2025–June 2026), the rate was 40.7%, and Q3 alone was 32.2%. FY2026
denials (7,639) already exceed all of FY2025.
Approvals vs. Denials Trends
Well-prepared petitions, with objective metrics, credible expert letters, and clearly mapped
evidence, still get approved.
Petitions that claim achievements without documentation, or leave the significance of evidence
unexplained, are denied at higher rates.
USCIS has not explained the decline, and the legal standard itself hasn’t changed. RFEs aren’t
counted in USCIS’s I-140 data, so a case approved after an RFE shows only as an approval.
Year-Over-Year Comparison (2023 → 2024 → 2025)
Period
EB-1A Approval Rate
FY 2024 (full year)
~72.2%
FY 2025 (full year)
66.9%
Q1 FY 2025 (Oct–Dec 2024)
74.7%
Q2 FY 2025
72.7%
Q3 FY 2025
66.5%
Q4 FY 2025
53.4%
Q1 FY 2026 (Oct–Dec 2025)
47.4%
Q2 FY 2026
41.7%
Q3 FY 2026 (Apr–Jun 2026)
32.2%
FY 2025 began near FY 2024 levels, then declined every quarter. In Q1 FY2026 USCIS denied more EB-1A
petitions than it approved for the first time in this series. The adjudication environment is
considerably stricter than a year ago. USCIS revises counts between releases, so verify against the
current file.
6. EB1A Success Rates by Area of Practice
USCIS does not publish EB-1A outcomes by field, so any field-level “success rate” is not verifiable.
What differs by field is the evidence typically available to meet the criteria:
The 2026 environment is shaped by rising denials, stricter evidentiary review, higher filing volume,
and a major change in RFE policy.
Rising RFE Rates and What they mean?
USCIS doesn’t publish I-140 RFE rates. A private dataset from early 2026 put the RFE rate for regularly
processed EB-1A petitions at roughly 46–49%. Treat that as directional, since it covers only that
company’s users. The larger change is policy. PA-2026-05, issued August 5, 2026, lets officers deny a
case directly, without an RFE or NOID, when required initial evidence is missing. An RFE is no longer a
dependable second chance, so the initial filing has to be complete.
8. What is prompting the fluctuations of 2025 Approval Standards?
Better Evidence Interpretation
Applicants must show measurable impact, independent recognition, and sustained acclaim. The final
merits determination is unchanged, and officers expect the petitioner to explain why each piece of
evidence matters rather than leaving it to inference. Vague or unsupported claims face the greatest
scrutiny.
Increased Filing Volume
Technologists, scientists, founders, and creatives are filing at high levels, which makes the pool more
competitive. Pending I-140 petitions reached 203,204 by the end of June 2026, up 10% from March.
The Rising RFE Issue
RFEs extend timelines, and under the August 2026 policy they may come with shorter response windows or
not at all. The challenge is submitting verifiable evidence that addresses the likely concerns at
filing.
Approval Rates by Industry
USCIS doesn’t publish rates by industry. It does publish by category, and the gaps are large:
O-1A: 91.0% in Q1 FY2026, versus 93.9% for FY2025.
EB-2 NIW: 55.3% in Q3 FY2026, up from a low of 35.7% in Q4 FY2025.
9. Trends in EB-1A Approval for Indian Applicants in 2025
More Scrutiny Attention
USCIS doesn’t publish EB-1A approval rates by country of birth. One analysis found India-born EB-1A
approvals fell from 29.8% of receipts in Q2 to 21.4% in Q3 FY2026, with China similar. That is a
different measure from an approval rate, and the decline spans nearly every country. USCIS is looking at
context and impact, including citation metrics, industry adoption, measurable innovation, and the role
of press.
RFE and NOID Rates
RFEs and NOIDs focus on ambiguity, unsupported achievements, repetition, and weak expert letters.
Strong petitions can resolve these concerns. Weak petitions often cannot, and may now be denied without
the chance.
More Emphasis on Measurable Impact
Officers look for citations, adoption of the work, patents in use, clinical outcomes, funding, and
revenue, tied to the applicant’s own contribution.
The Role of Premium Processing
The I-140 premium processing fee is $2,965 since March 1, 2026. It buys speed, not a different
standard. For India-born applicants, visa availability is the bigger constraint. In the November 2026
Visa Bulletin, EB-1 India remains at February 1, 2023 and China advances one month to August 1, 2023,
while all other countries are current. The Dates for Filing cutoff is July 1, 2024 for both India and
China, and USCIS will use the Dates for Filing chart for employment-based adjustment filings in
November. USCIS reviews the chart monthly, so December is unconfirmed.
Commonality with Approved Applications
Clear mapping of evidence to factors
Independent press and outlet validation
Strong letters from respected authority
Evidence delivered with measurements and impact
Most Common Reasons for EB-1A Rejections
Inadequate evidence of sustained recognition
Absence of measurable or independently verifiable influence
Lack of third-party verification (media coverage, awards, citations)
Weak or generic expert letters
Missing initial evidence at filing
Poor organization of the narrative
10. What the Highest Approval Prospective Applicants did differently in 2025?
Approved applicants generally had:
Clear mapping of evidence to each criterion
Objective metrics supported by verifiable evidence
Independent media and press coverage
Explicit, credible expert letters from engaged authorities
Demonstrated impact on the field, not only success in their profession
Comparing the EB-1A Approval Rates to Other Immigrant Categories
EB-1B: about 93.8%, an employer-sponsored category.
EB-1C: about 97.2%, also employer-sponsored.
O-1A: about 91%, non-immigrant and less stringent than EB-1A.
EB-2 NIW: 55.3% in the latest quarter, now above EB-1A.
11. How 2025 Trends will impact Prospective Applicants who file in 2025 - 2026?
Predictions
Continued emphasis on objective, data-driven evidence
Increased scrutiny of independent validation
Greater specificity required on influence and the significance of each exhibit
Map evidence carefully to each criterion and the final merits standard
What is Demonstrated by the Assessment Process?
Quantifiable influence
Meaningful third-party emphasis
Demonstrated capacity for shaping the field
Demonstrated originality or innovation
The EB-1A environment now has more denials, tighter evidence rules, and an increased emphasis on
measurable professional impact. Applicants with a clear, organized petition and documented, quantifiable
accomplishments can still succeed. Entering 2027, if current patterns hold, the strongest applicants
will be those with reliable documentation, credible expert letters, and strategic evidence
presentation.
EB-1A Experts can ensure that someone is
building a petition that meets the contemporary standards of USCIS. Our assistance includes
individualized strategy, documentation support, and end-to-end development of your petition.
Promote your evaluation today and enhance your likelihood of EB-1A Approval.
12. FAQs
1. What is the EB-1A approval rate in 2025?
The full fiscal year 2025 rate was 66.9%, but it fell from 74.7% in Q1 to 53.4% in Q4, and the latest
published quarter (April–June 2026) was 32.2%. The rate is approvals divided by approvals plus denials,
and it does not count RFEs.
2. Why are approval rates fluctuating this year?
USCIS hasn’t given a reason. Documented factors include higher filing volume, evidence-policy changes,
and processing holds. A rate describes a whole population, not any one petition.
3. Do Indian applicants face lower approval rates?
USCIS doesn’t publish EB-1A rates by country, so this can’t be confirmed. India-born applicants also
face a Visa Bulletin wait: EB-1 India’s final action date is February 1, 2023 in the November 2026
bulletin.
4. Which fields have the highest EB-1A success rate?
USCIS doesn’t publish by field. Fields with measurable, third-party-verifiable evidence, such as
citations, funding, and rankings, generally make stronger records.
5. How do RFEs impact approval rates?
RFEs aren’t counted in USCIS rate data. Since August 5, 2026, officers can deny without issuing one, so
the initial filing carries more weight.
Harshal Deshpande is a former journalist and editor who now writes on EB-1A at EB1A Experts. He covers the ten criteria, the Kazarian two-step, and how EB-1A compares with other visa pathways. He has also helped clients shape their Letters of Recommendation, so his writing draws on real petitions as well as research.
Was this article helpful?
Sorry, your feedback couldn't be saved. Please try again.
October 2025 is likely to be more than just the start of a new fiscal year for U.S. immigration. It
could also represent a shift in the U.S. immigration system itself, including....

 October 28, 2025
 3 min read